The argument in three lines
Worldwide IT spending will reach $6.31 trillion in 2026 — up 13.5% on last year, with data centre systems alone growing nearly 56%. Before deciding what that means, it is worth looking at the shape of the last four decades rather than the level.
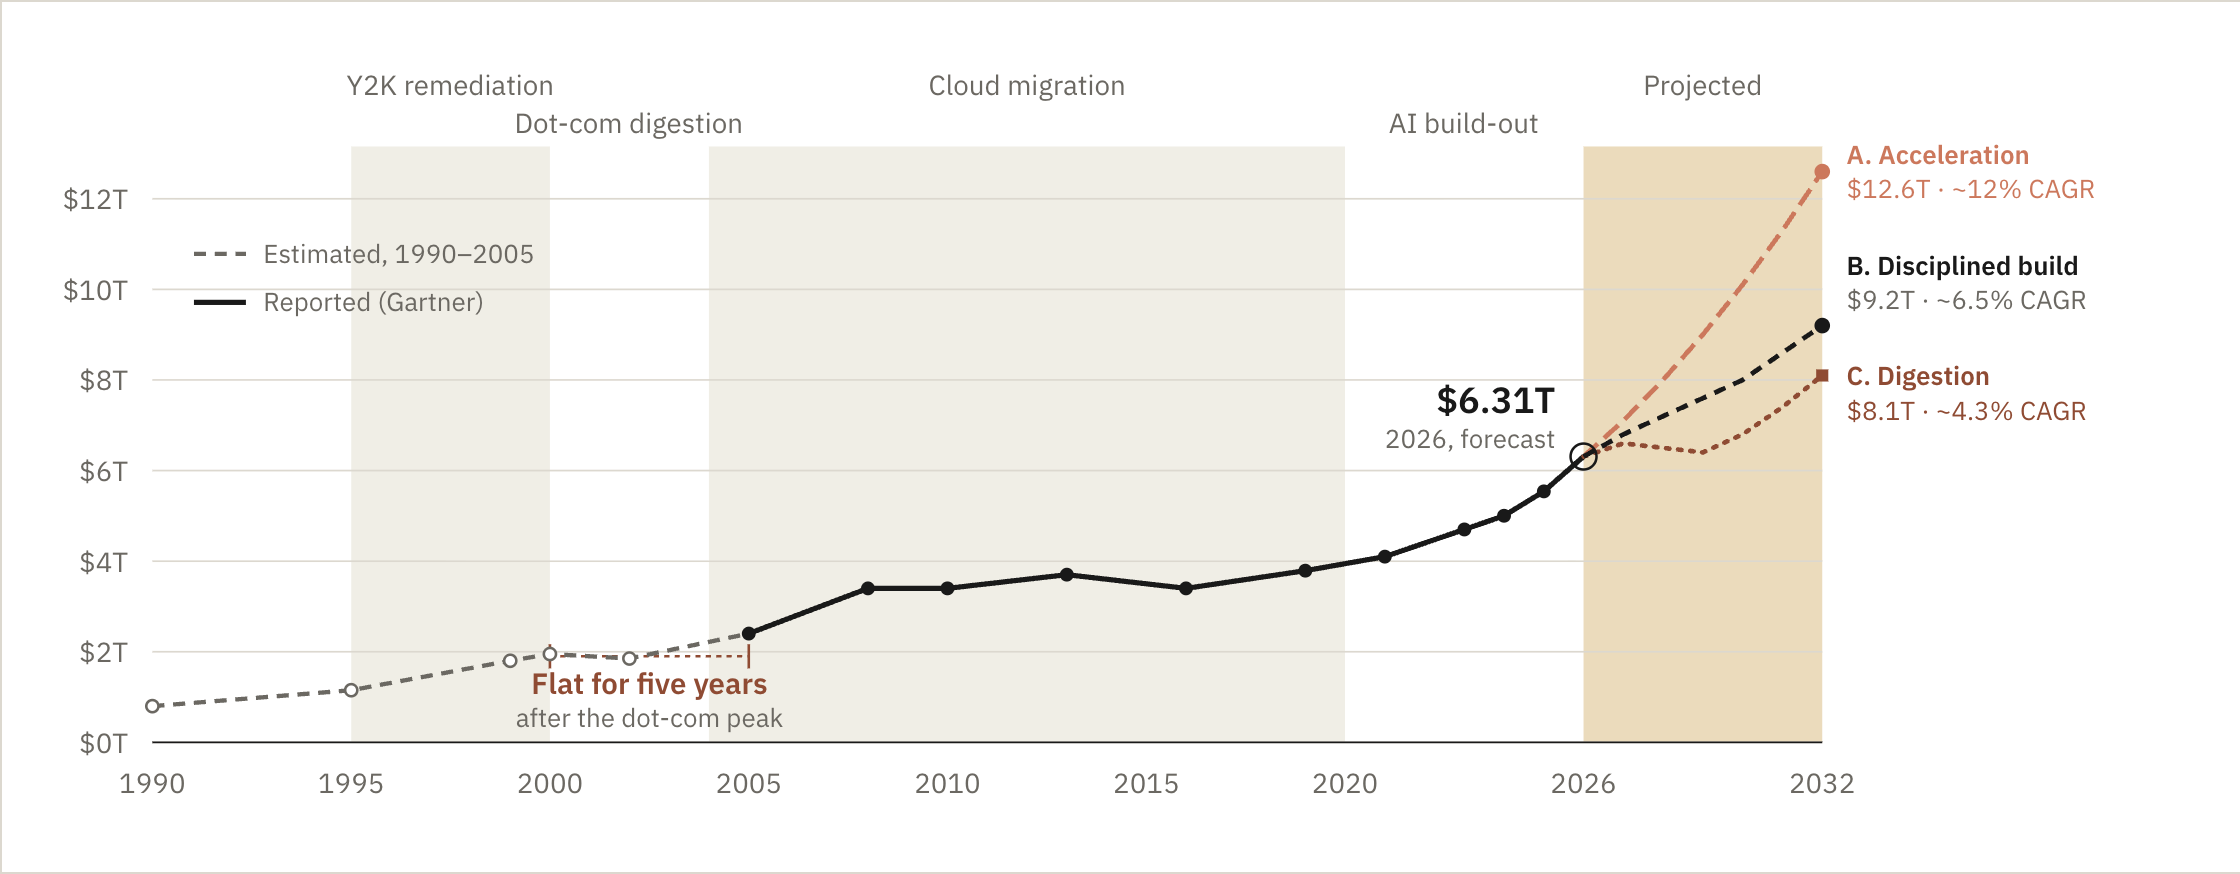
Three things stand out. Spending roughly doubled in the late 1990s. Then it went flat for five years — not down, just flat, while the capacity already built was absorbed. Then it ground upward through the cloud decade at a pace nobody wrote headlines about. And since 2023 it has bent almost vertically.
Each bend had a forcing function, and they are not interchangeable:
Four eras, four forcing functions, one obvious question: what did any of it pay back?
Put three series on one axis — labour productivity, equity returns, corporate net margin — and the shape of the answer is hard to unsee.
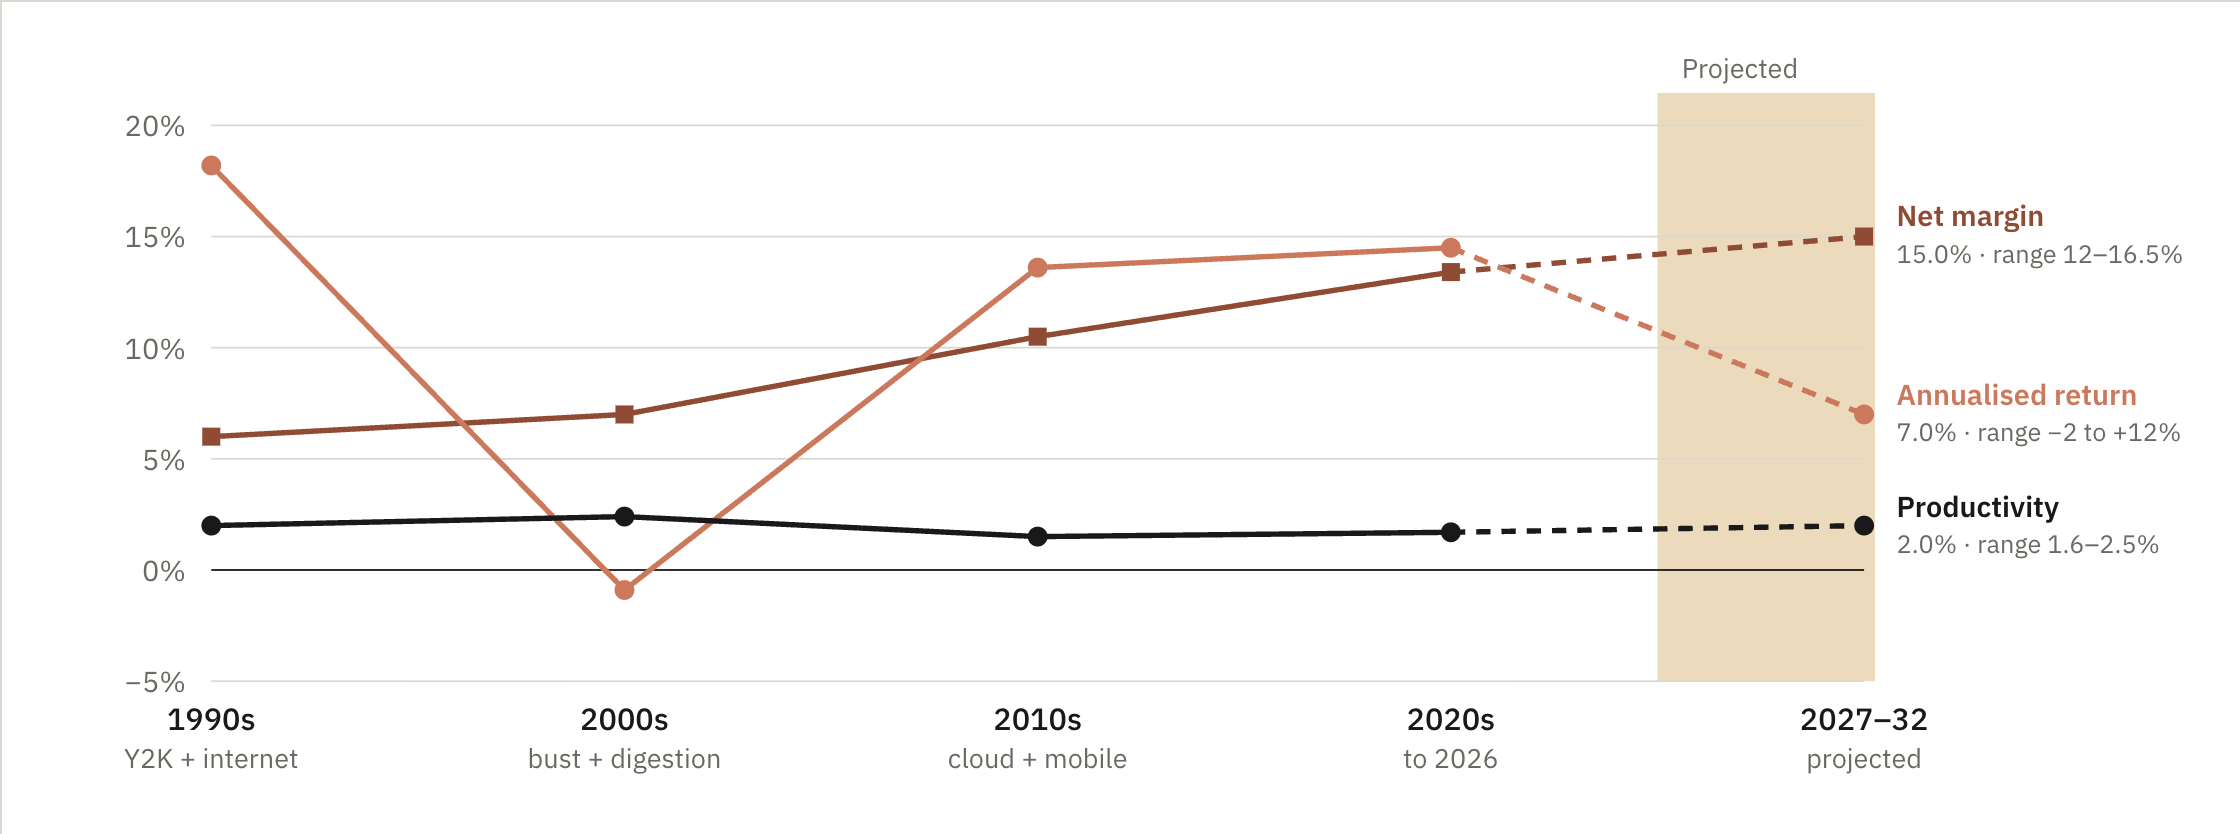
US labour-productivity growth ran at about 2% a year in the 1990s and spiked near 3.3% in the 2000–05 window, then fell back to roughly 1.5% for the entire cloud decade. It has not recovered.
Now look at margin. The S&P 500’s blended net profit margin hit 13.4% in Q1 2026 — the highest since FactSet began tracking the measure in 2009 — after sitting in the mid single digits through the 1990s.
IT spending has been converted into margin — pricing power, cost displacement, concentration — far more reliably than into output per hour. Whatever your board says it is measuring, that is the scoreboard it is actually using.
The standard narrative says 1990s IT investment produced the late-90s productivity boom. McKinsey Global Institute spent a year testing that and published the results in October 2001. What they found was that virtually all of the 1995–2000 acceleration came from just six sectors — retail, wholesale, securities, semiconductors, computer manufacturing and mobile telecom. Within those sectors, IT was not found to have a dramatic independent impact; it contributed to roughly the same degree as other factors of production. The primary drivers were competition and industry-specific innovation.
MGI’s 2017 follow-up sharpened it: the gains materialised only where complementary business-process change happened, usually because competitive pressure forced it. Two cases from the same decade, on the same technology, make the point better than any model.
Same technology. Same era. Same spend trajectory. Opposite outcomes. Convenience without restructuring produced no productivity gain at all.
Three inferences follow — each held loosely enough to be argued out of.
The productivity surge didn’t coincide with 1990s spending. It arrived after it, while budgets were frozen and the vendors were going bankrupt. Meanwhile 85% of that decade’s fiber was still dark by the mid-2000s, and eventually got used at pennies on the dollar by Netflix and Google. Overbuild is not the same thing as waste; it is a transfer from the people who financed it to the people who arrive after the write-down.
The AI version has one important difference, and it cuts against the optimists. Fiber in the ground depreciates over twenty-plus years, and its salvage value survived the bust. A GPU fleet depreciates over three to five — the salvage value of an AI overbuild is far thinner.
If the 1990s payoff came from six sectors that restructured under pressure, the question for a board is not “how much are we spending on AI.” It is which of our businesses is under enough competitive pressure to actually restructure around it. Budget is the easy variable, and the one least correlated with outcome.
The current evidence is consistent with that. McKinsey’s 2025 State of AI survey found near-universal adoption and almost no enterprise-level financial effect: 88% use AI in at least one business function, 39% report any enterprise-level EBIT impact (most below 5%), 7% describe AI as fully scaled, and roughly 6% qualify as high performers.
What separates the top group is not model quality or budget. It is workflow redesign. MIT’s NANDA study reached the same place by a different route, finding the overwhelming majority of GenAI pilots delivering no measurable P&L impact, with the gap traced to enterprise integration rather than to the technology. This is the ERP story and the lift-and-shift cloud story, repeated with new nouns.
Total IT-related investment has reached about 5% of US GDP, exceeding the dot-com peak. But unlike 2000, which was driven almost entirely by firms using IT, this boom is driven by the firms producing it. For a large non-tech enterprise, your own AI budget is a rounding error next to the supply-side build: you are a price-taker on compute. That argues for a specific posture — be a late, cheap, aggressive buyer of compute rather than an early builder. It is close to the opposite of what most 2025–26 AI strategies assumed.
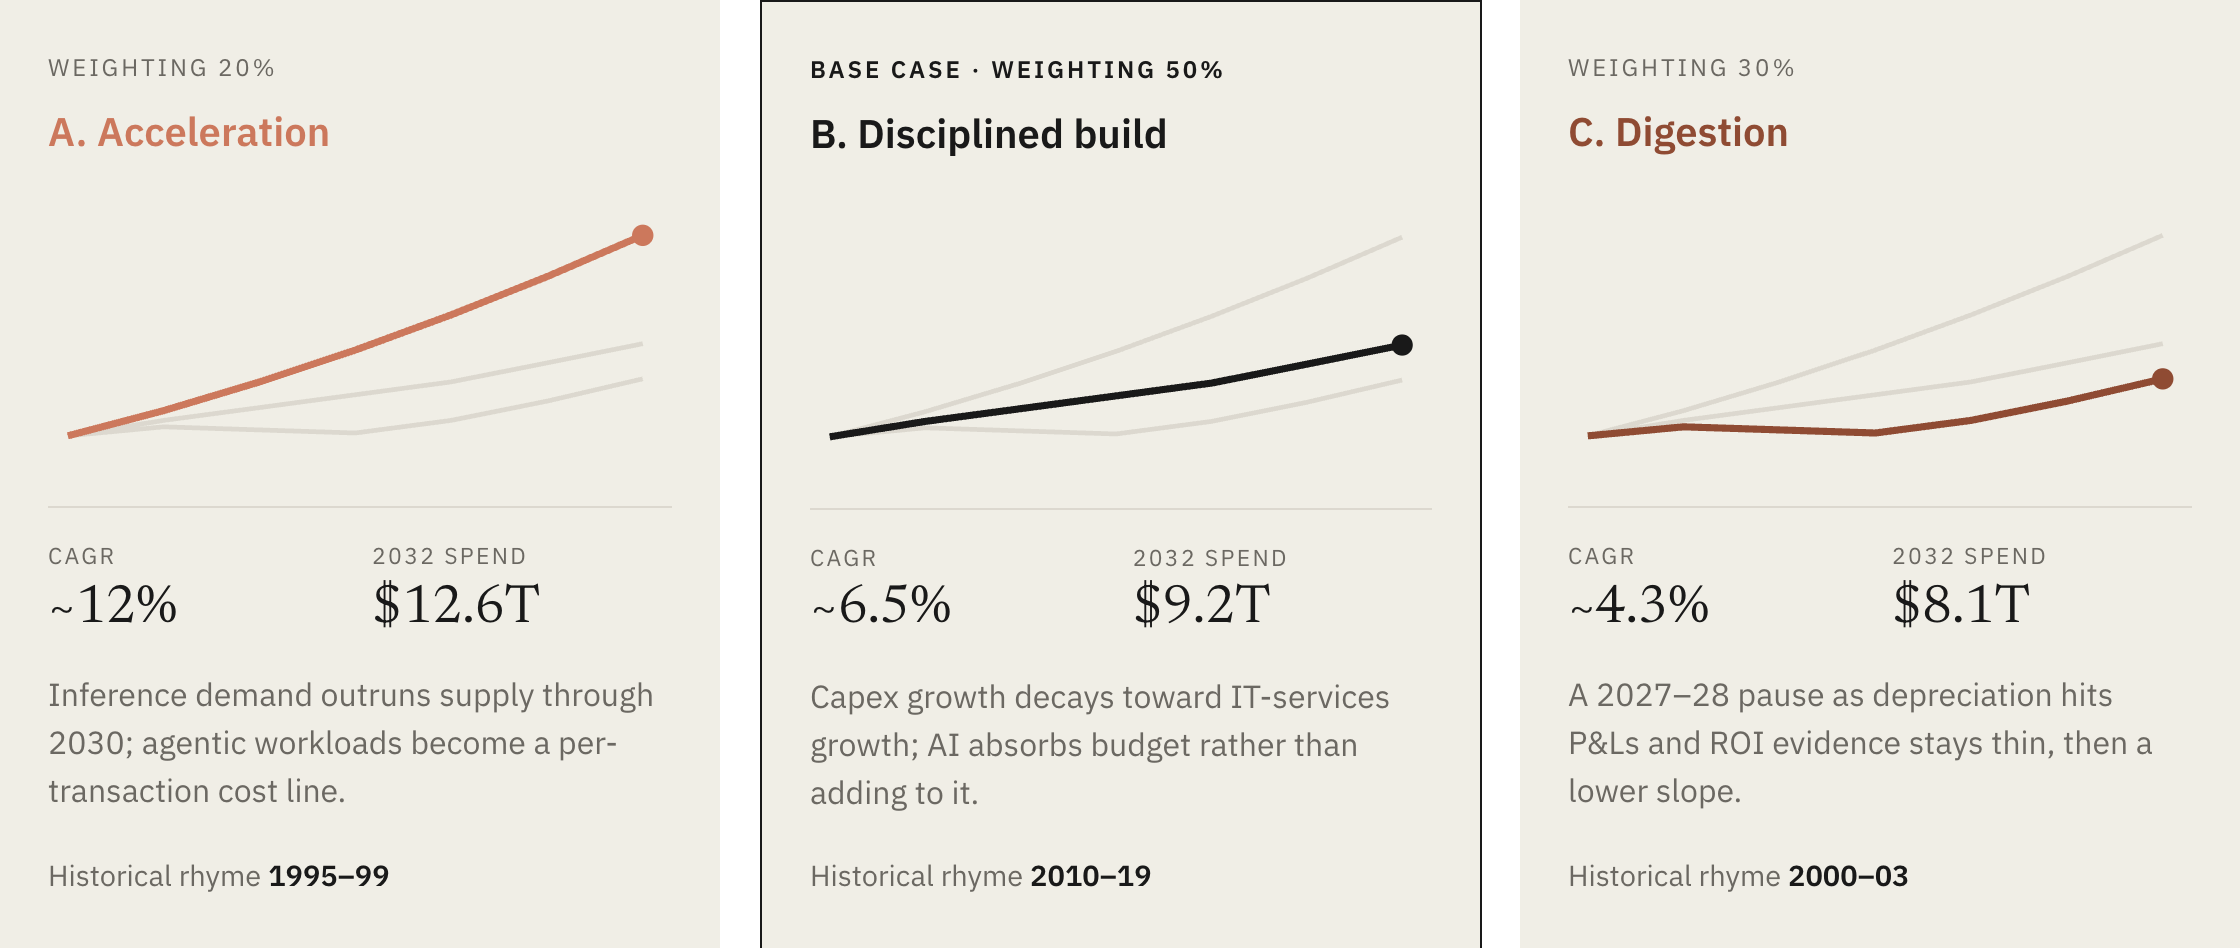
Rather than a single forecast, three scenarios, weighted by judgement rather than by any model. Each has a historical rhyme — which is the honest way to describe how the weighting was reached.
Five things worth putting in front of a board this quarter.
Four observable markers, each with a direction attached before the fact:
Global IT spend in the 1990s was roughly $2 trillion a year, and it coincided with productivity growth around 2.4%. The base case for 2027–32 is $8–9 trillion a year against productivity growth near 2.0%. If that holds, AI’s aggregate economic return per dollar will be materially worse than the internet’s.
That is not an argument against spending. It is an argument about dispersion. Aggregate productivity figures average the leaders together with the non-adopters and the failed implementations. The 1990s produced Walmart and retail banking, out of the same technology in the same decade. Which one you resemble was determined by whether you restructured, not by what you spent.
Every one of these cycles came down to the same constraint: not the technology, and not the budget, but whether the organisation had the people and the process design to restructure around it. That is the part that doesn’t arrive with the invoice.
The spend is the easy part. It always was.
Gartner worldwide IT spending forecasts (April 2026: $6.31T for 2026, +13.5%; $7.6T by 2029). McKinsey Global Institute, US Productivity Growth 1995–2000 (October 2001) and its 2017 follow-up. McKinsey State of AI 2025. MIT NANDA. BCG AI-adoption survey, 2026. BLS and IMF productivity series. FactSet S&P 500 net margins (Q1 2026 blended: 13.4%, highest in the series since 2009). Hyperscaler capex guidance as reported through Q1 2026 — Amazon about $200B, Alphabet $175–190B, Meta $115–145B, Microsoft $120B and above, together roughly $725B and about 77% above 2025.
Pre-2005 spend is estimated, because definitions of “IT spending” changed materially over that period. Projections are scenarios, not forecasts. The equity-return series is illustrative and is not investment advice.